How BitsBySugar Used OpenTelemetry with Node.js to Improve Backend and DB Performance
Overview
We recently worked with a client who had a backend system using NestJS with Fastify Adapter as the preferred backend framework, Postgres on AWS RDS with TypeORM for the database, and NextJS for the frontend. The app was receiving about 200 requests/sec with close to 450 DB calls per second, and we needed to scale quickly. However, monitoring issues became a major problem. While we had caching with Redis on some API requests, we needed monitoring data to improve performance.
We considered using Sentry, but found the cost unjustifiable for our needs. That's when we discovered Opentelemetry - an open-source solution that had just enough features for us to implement the right caching and indexing on the DB.
Challenges
- Monitoring Issues: Monitoring issues became a major problem as the traffic to the backend system increased. The team struggled to monitor the system's performance and identify performance issues.
- Cost of monitoring solutions: The team considered using Sentry, but found the cost unjustifiable for our needs. Which pushed us towards exploring different avenues and we are glad that we found Opentelemtry, great thing about it being opensource was icing on the cake, it was cost effective and everything we needed at the time.
- Scaling quickly:The client's backend system had to scale quickly due to the increase in traffic. We had to quickly identify performance bottlenecks and implement solutions to handle the increased traffic.
- Implementing the right caching and indexing:We needed monitoring data to implement the right caching and indexing on the database.
Solution
We decided to implement Opentelemetry with Signoz to track application performance. We used NodeJS telemetry adapter with signoz and the process to set up Opentelemetry was breeze, you need to grab the Docker image from their website and host it on an EC2 server or other similar cloud solutions. After hosting it, it was just a one-file setup to complete the entire integration.
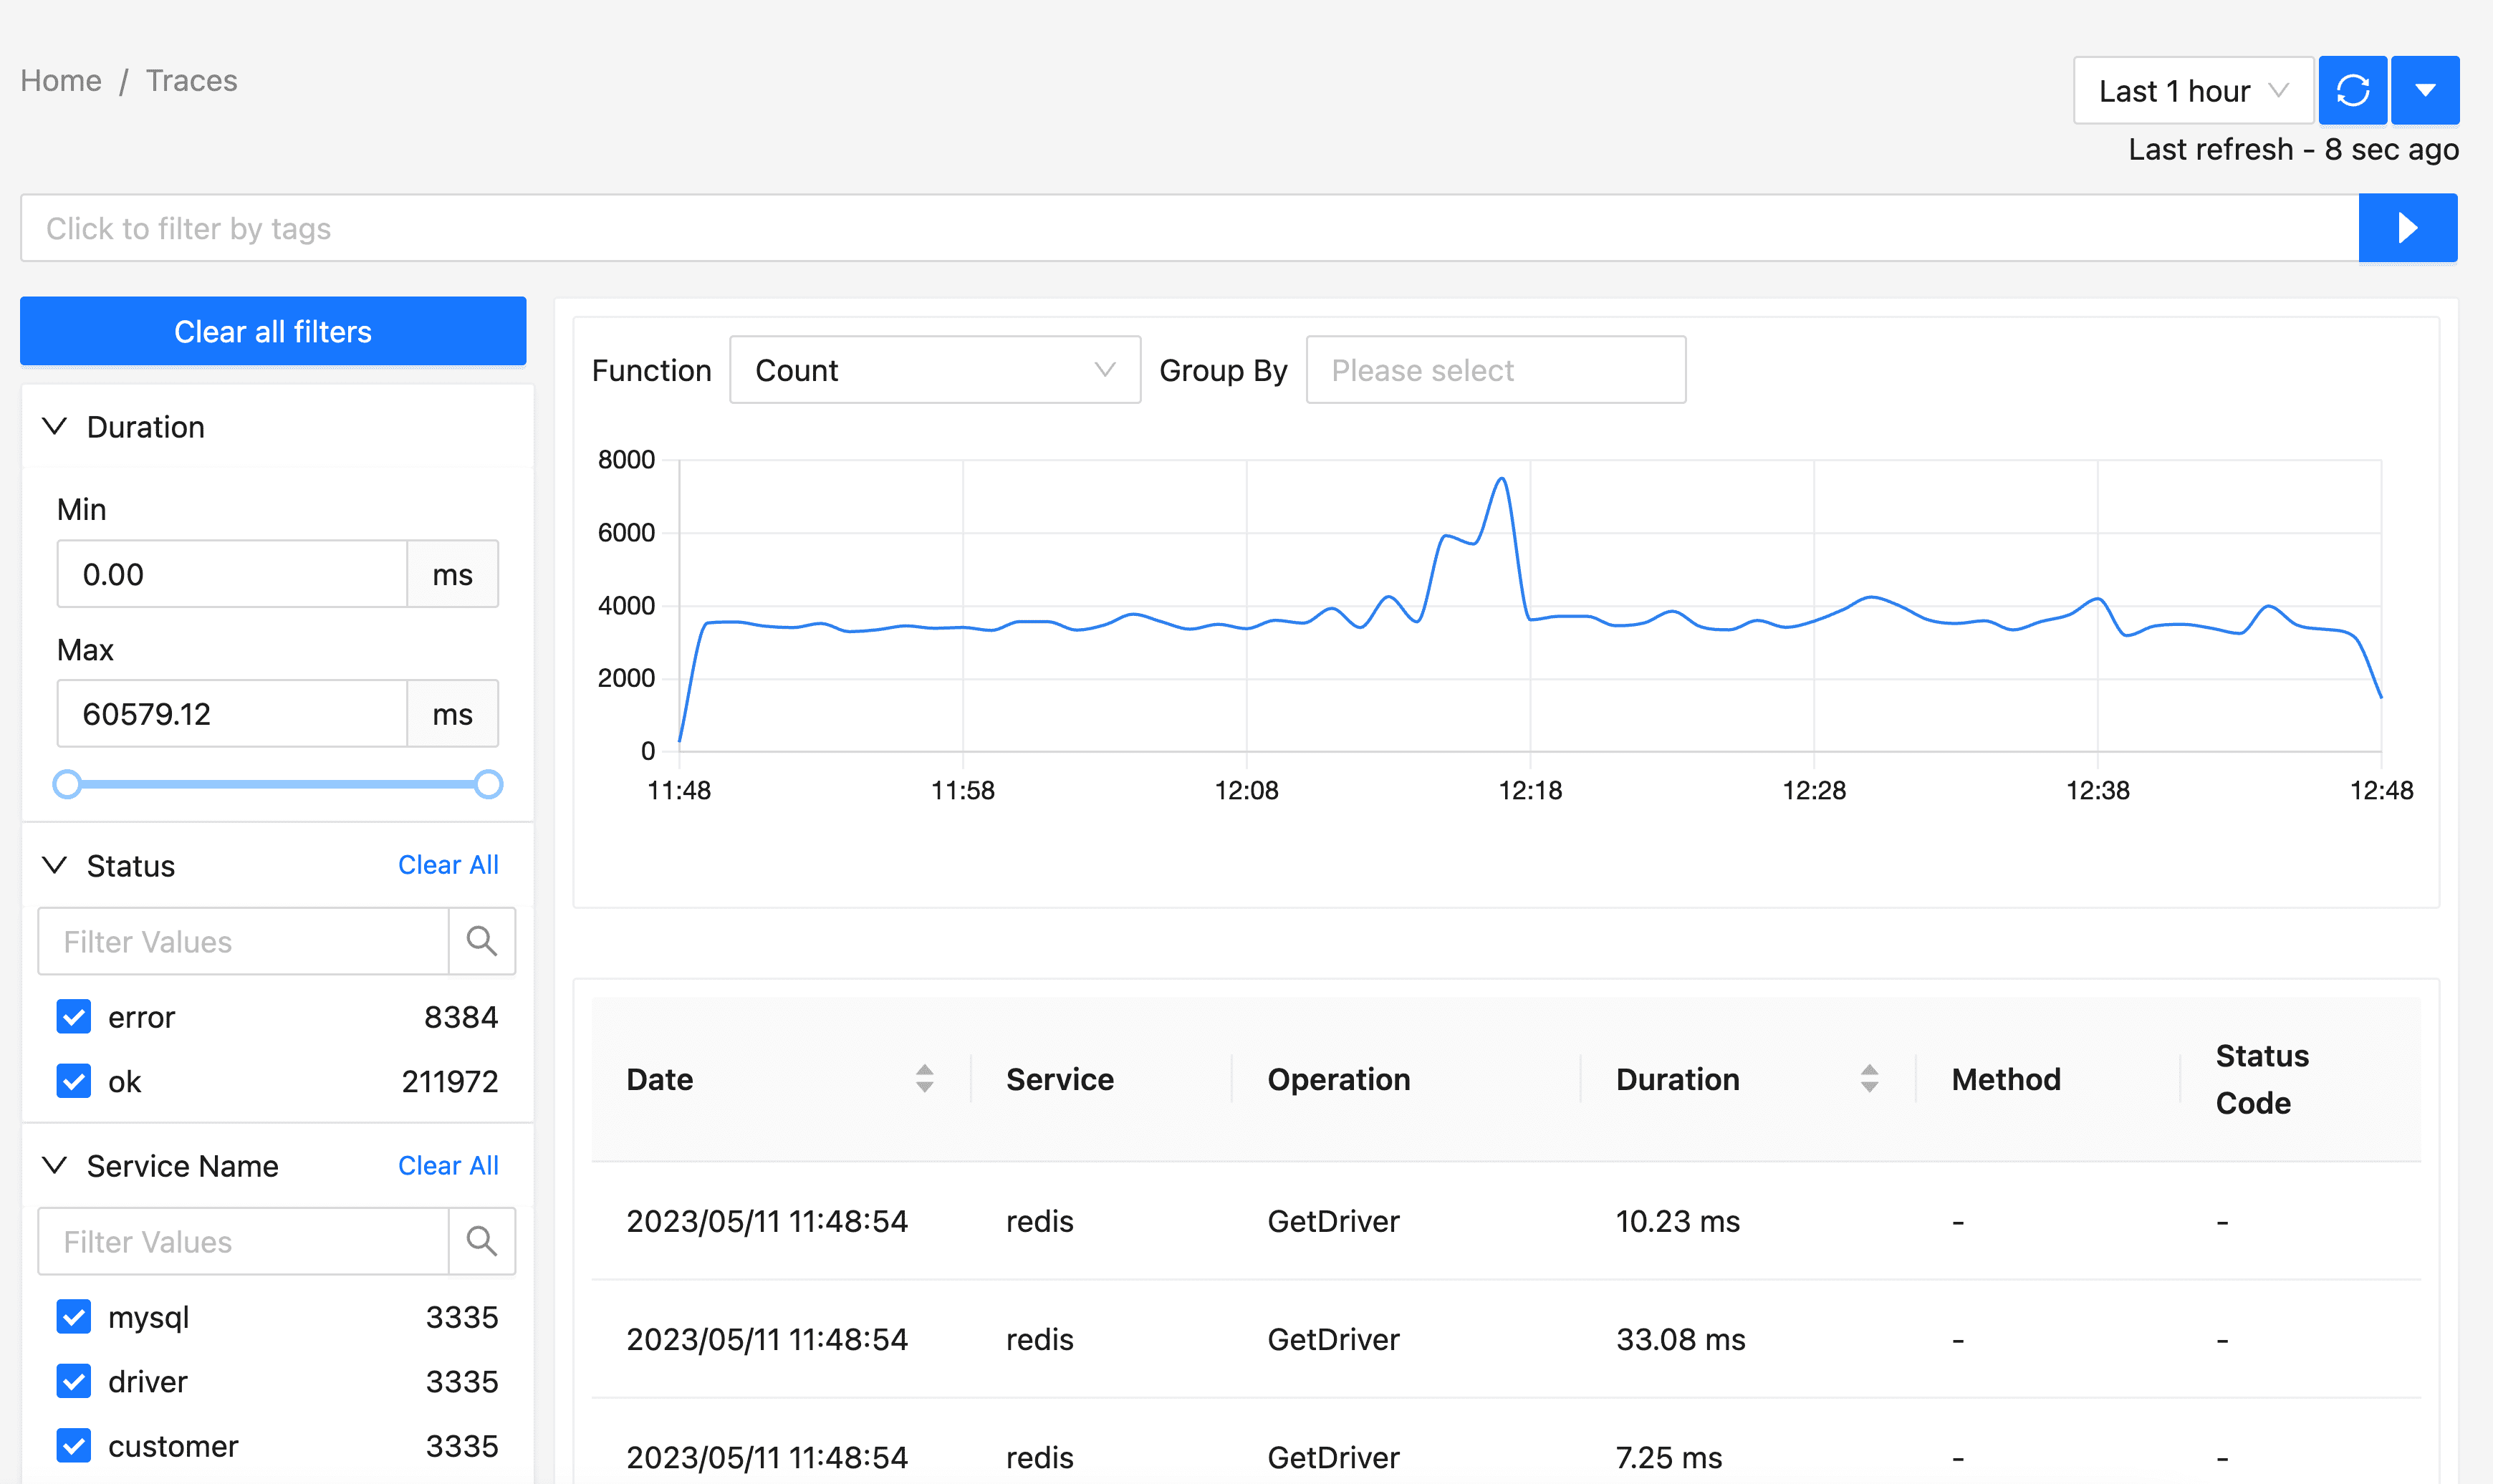
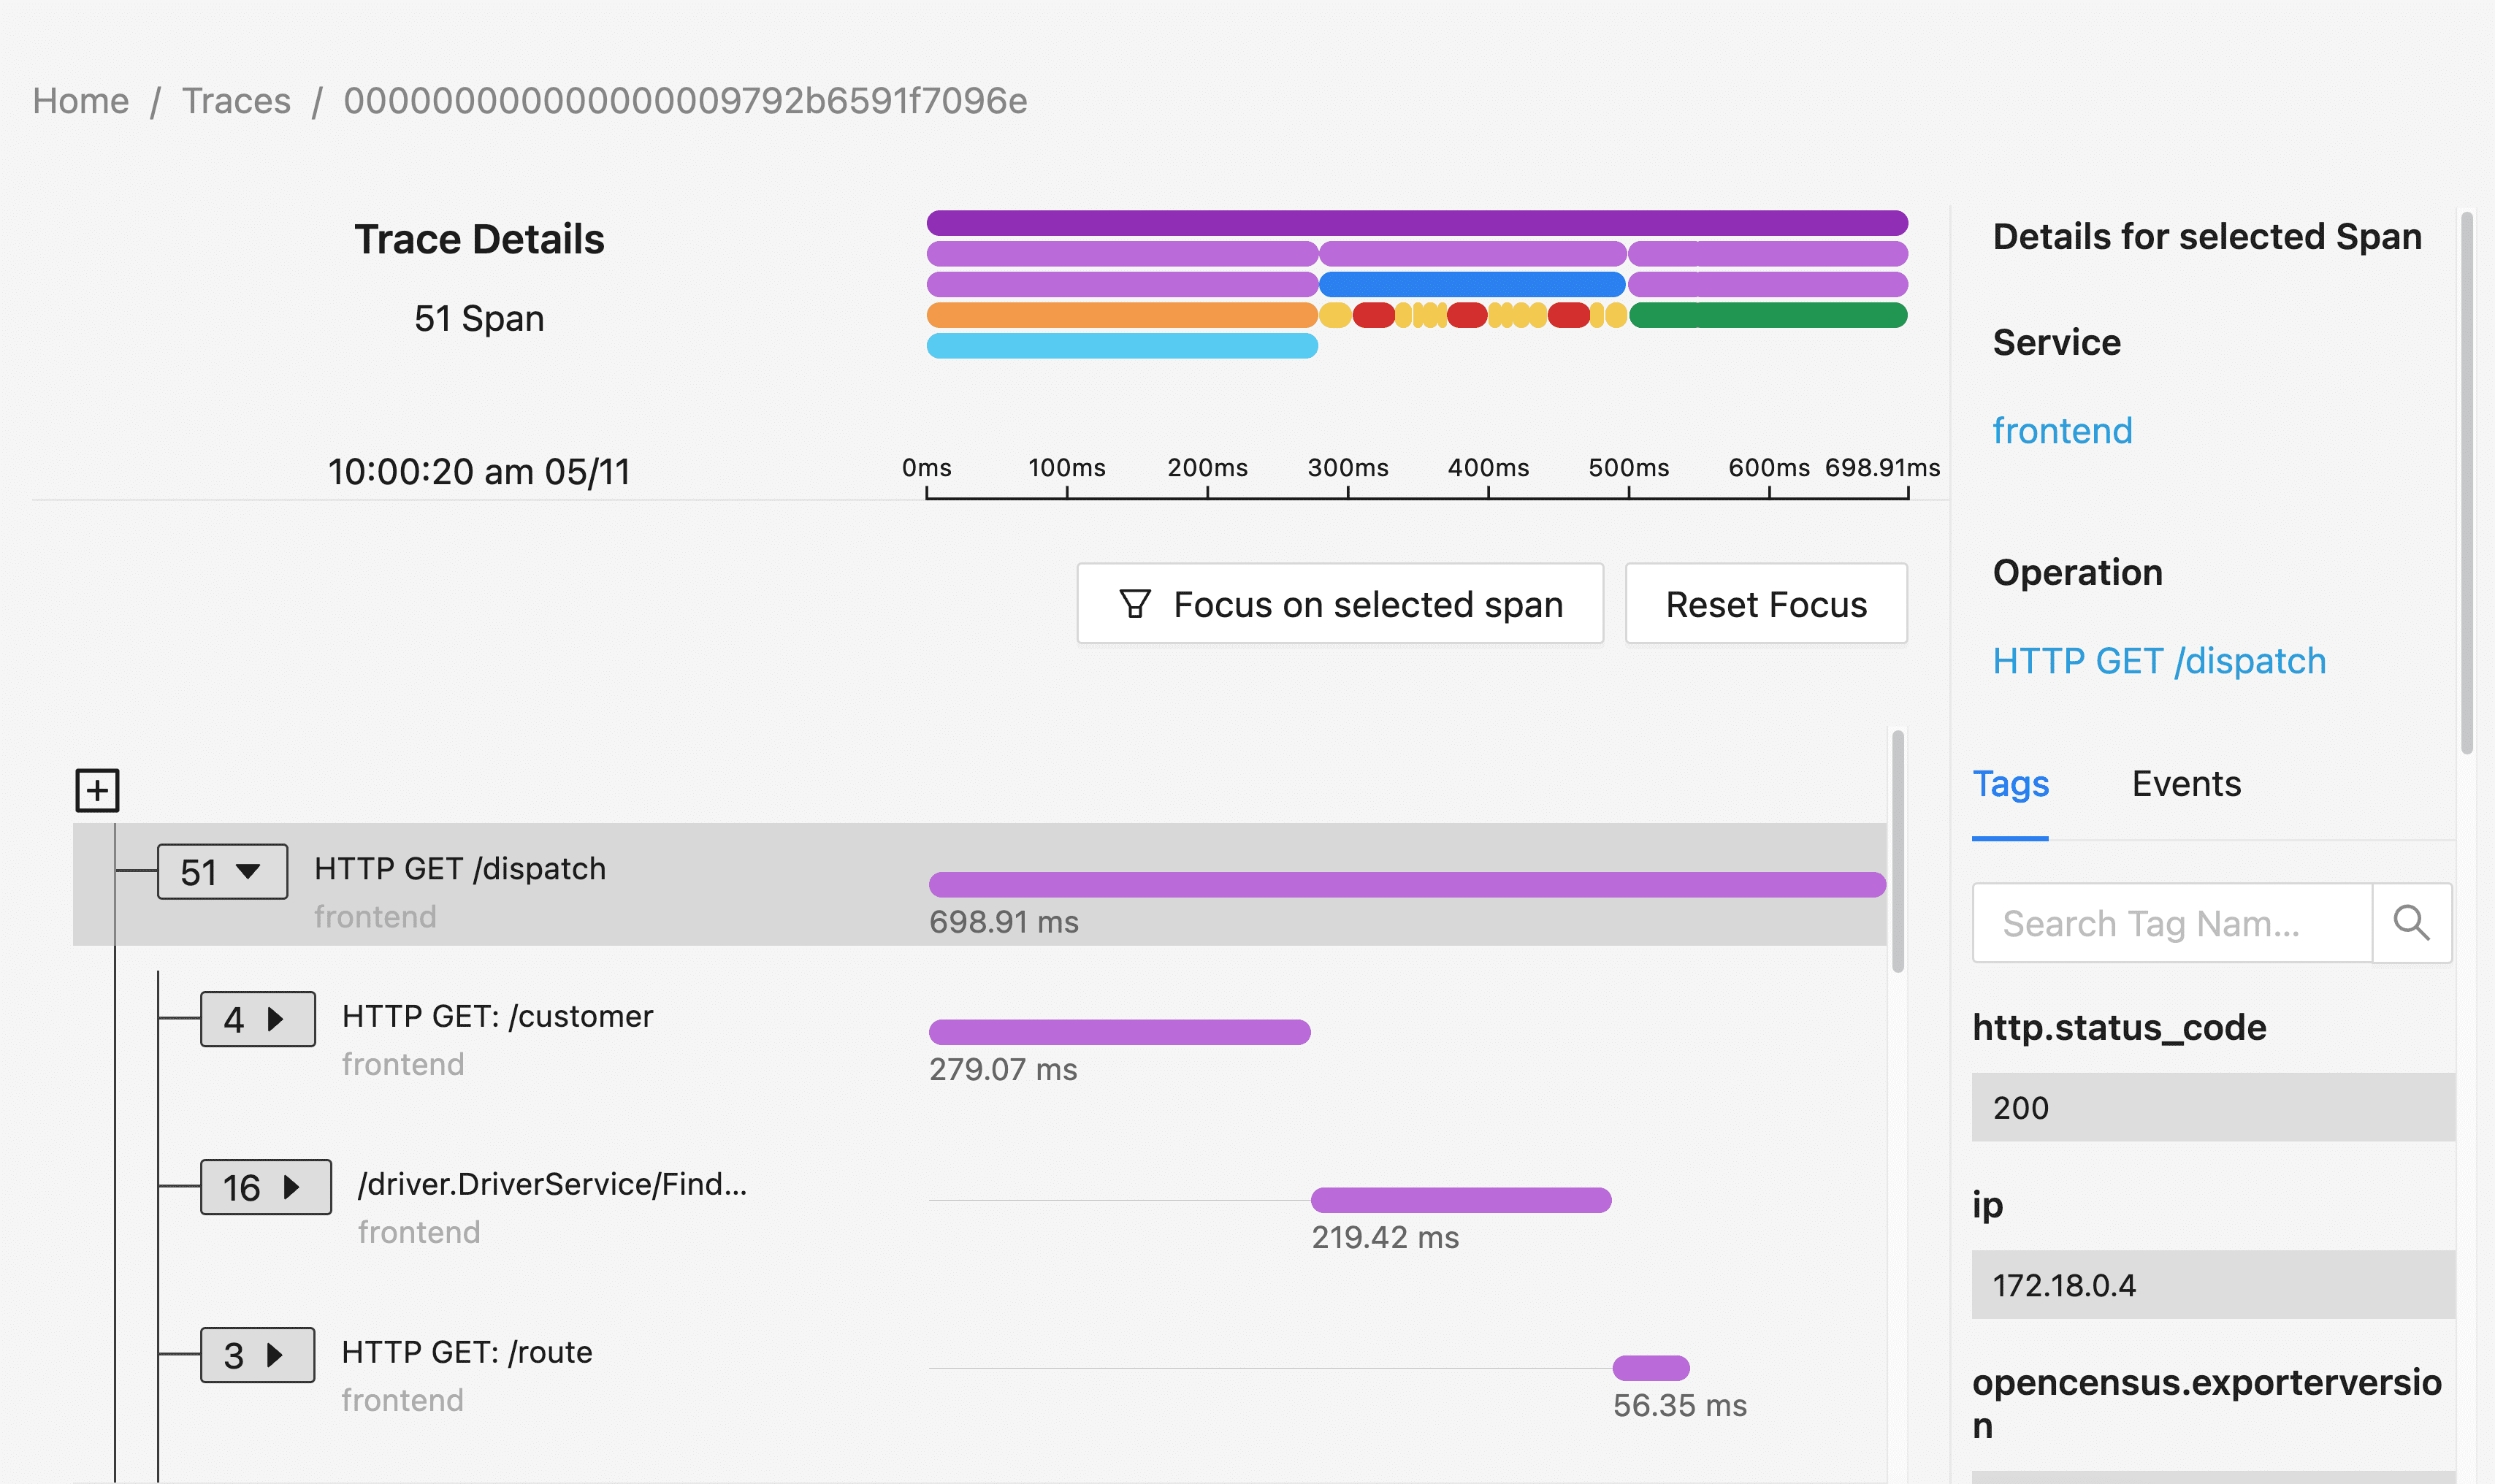
Once complete, we could monitor the app's latency and error rate with filters, see a list of all the tracers, and view a waterfall design for individual traces. After analyzing the data, we were able to implement the right indexes on the DB and the right caching with Redis to make data load almost instantly with a response rate time of under 100ms for all our backend requests.
Sample NodeJS setup File
'use strict';

import { getNodeAutoInstrumentations } from '@opentelemetry/auto-instrumentations-node';
import { OTLPTraceExporter } from '@opentelemetry/exporter-trace-otlp-http';
import { Resource } from '@opentelemetry/resources';
import * as opentelemetry from '@opentelemetry/sdk-node';
import { SemanticResourceAttributes } from '@opentelemetry/semantic-conventions';

// Configure the SDK to export telemetry data to the console
// Enable all auto-instrumentations from the meta package
const exporterOptions = {
    url: '<tracer_endpoint>',
};

const traceExporter = new OTLPTraceExporter({ ...exporterOptions });
const sdk = new opentelemetry.NodeSDK({
    traceExporter,
    instrumentations: [getNodeAutoInstrumentations()],
    resource: new Resource({
        [SemanticResourceAttributes.SERVICE_NAME]: '<app_name>',
    }),
});

// initialize the SDK and register with the OpenTelemetry API
// this enables the API to record telemetry
sdk.start();

// gracefully shut down the SDK on process exit
process.on('SIGTERM', () => {
    sdk.shutdown()
        .then(() => console.log('Tracing terminated'))
        .catch((error) => console.log('Error terminating tracing', error))
        .finally(() => process.exit(0));
});

export default sdk;
Improvements

App List View (Application Homescreen), Lists all the apps connected to the Opentelemetry Instance

List to All the traces for the selected app, you can filter the traces, check latency, error rate and other metrics

Details of Individual trace, with waterfall view.
Conclusion
In conclusion, the successful implementation of Opentelemetry with NodeJS, Signoz, and the appropriate caching and indexing measures allowed the team to improve the performance of the client's backend system, while keeping costs low. The system was able to scale to handle hundreds of requests per second and provide a highly responsive user experience.
This case study highlights the importance of effective monitoring and the value of using open-source and cost-effective solutions. With the right tools and techniques, it's possible to address performance issues and optimize a system for high volumes of traffic without breaking the bank.
Opentelemetry proved to be a highly effective solution for monitoring the system's performance. It allowed the team to easily identify and address performance issues, and its open-source nature meant that it was highly cost-effective for the team to implement.
By using Signoz as an alternative to Sentry, the team was able to address budget constraints without compromising on the quality of the solution. This demonstrates the value of considering alternative solutions and not being restricted to well-known, expensive tools.
So a combination of the right tools, techniques, and an agile approach can lead to successful outcomes, even when working with a tight budget and under pressure to deliver results quickly.
Tech Stack Used
- NodeJS (NestJS - Typescript) as the backend framework
- TypeORM with Postgres for Database
- CI/CD Tool Used: Gitlab CI/CD
- Cloud Infrastructure: AWS with Load Balancers on AWS ECS
- NextJS to serve frontend.
- Signoz Opentelemetry for monitoring.