Bull Queue with OpenTelemetry and Signoz = ❤️
Overview
We recently collaborated with a client, whose backend, developed and maintained by us, revealed through Opentelemetry data from Signoz, intermittent bursts of compute activity on the RDS PostgreSQL database. These bursts were triggered by processing data from a few internal requests, causing spikes in latency for consumer-facing (frontend) requests.
The backend operated on a master-slave architecture, where load-balanced masters handled all database writes/updates from incoming requests from slave servers. Despite the transient nature of these bursts, upgrading the RDS instance size seemed futile due to the intermittent workload increase, resulting in resource wastage. Although the database typically operated under a 40% load, during these bursts, it spiked to over 80%, leading to heightened latency in API response times across the entire system.
Challenges
- Upgrading the RDS Instance: Upgrading the RDS instance was not a viable option, since the database typically operated under a 40% load, and the bursts were intermittent. The added cost of upgrading the RDS instance would have been unjustifiable.
Solution
Upon analyzing OpenTelemetry data provided by Signoz, we pinpointed the requests responsible for the intermittent bursts and devised a strategy to address them effectively. Opting for a queue-based solution, we selected Bull Queue, a Redis-backed queue specifically tailored for NodeJS environments, to manage the processing of these requests.
By implementing this queue system, we aimed to reduce the compute load on the RDS PostgreSQL database by offloading the processing of all requests in parallel to a queue processing specified number requests concurrently. This approach ensures that the database workload remains stable and stays within acceptable limits providing acceptable performance, even during peak activity periods.
Sample NodeJS setup File for Signoz
'use strict';

import { getNodeAutoInstrumentations } from '@opentelemetry/auto-instrumentations-node';
import { OTLPTraceExporter } from '@opentelemetry/exporter-trace-otlp-http';
import { Resource } from '@opentelemetry/resources';
import * as opentelemetry from '@opentelemetry/sdk-node';
import { SemanticResourceAttributes } from '@opentelemetry/semantic-conventions';

// Configure the SDK to export telemetry data to the console
// Enable all auto-instrumentations from the meta package
const exporterOptions = {
    url: '<tracer_endpoint>',
};

const traceExporter = new OTLPTraceExporter({ ...exporterOptions });
const sdk = new opentelemetry.NodeSDK({
    traceExporter,
    instrumentations: [getNodeAutoInstrumentations()],
    resource: new Resource({
        [SemanticResourceAttributes.SERVICE_NAME]: '<app_name>',
    }),
});

// initialize the SDK and register with the OpenTelemetry API
// this enables the API to record telemetry
sdk.start();

// gracefully shut down the SDK on process exit
process.on('SIGTERM', () => {
    sdk.shutdown()
        .then(() => console.log('Tracing terminated'))
        .catch((error) => console.log('Error terminating tracing', error))
        .finally(() => process.exit(0));
});

export default sdk;
Sample Bull Queue setup File for NestJS
/** @format */
import { BullModule } from '@nestjs/bull';
import { Module } from '@nestjs/common';

import ConfigService from '../services/config.service.js';
import ConfigModule from './config.module.js';

@Module({
    imports: [
        ConfigModule,
        BullModule.forRootAsync({
            useFactory: async (configService: ConfigService) => {
                return {
                    redis: {
                        host: '<some_redis_host>',
                        port: 6379,
                    },
                    settings: {
                        maxStalledCount: 10,
                    },
                    defaultJobOptions: {
                        attempts: 1,
                        removeOnComplete: { age: 3600 * 10, count: 5000 },
                        removeOnFail: {
                            count: 20000,
                            age: 3600 * 20,
                        },
                        timeout: 3600,
                    },
                };
            },
            inject: [ConfigService],
        }),
        ,
    ],
    providers: [],
    exports: [],
})
export class AppModule {}
Improvements
Since implementing Bull Queue, our backend infrastructure has seen notable enhancements. The queue efficiently manages requests, curbing bursts of compute activity and maintaining stable database loads. This ensures minimal latency for consumer-facing operations, even during peak times. Resource utilization is optimized, eliminating the need for costly upgrades.

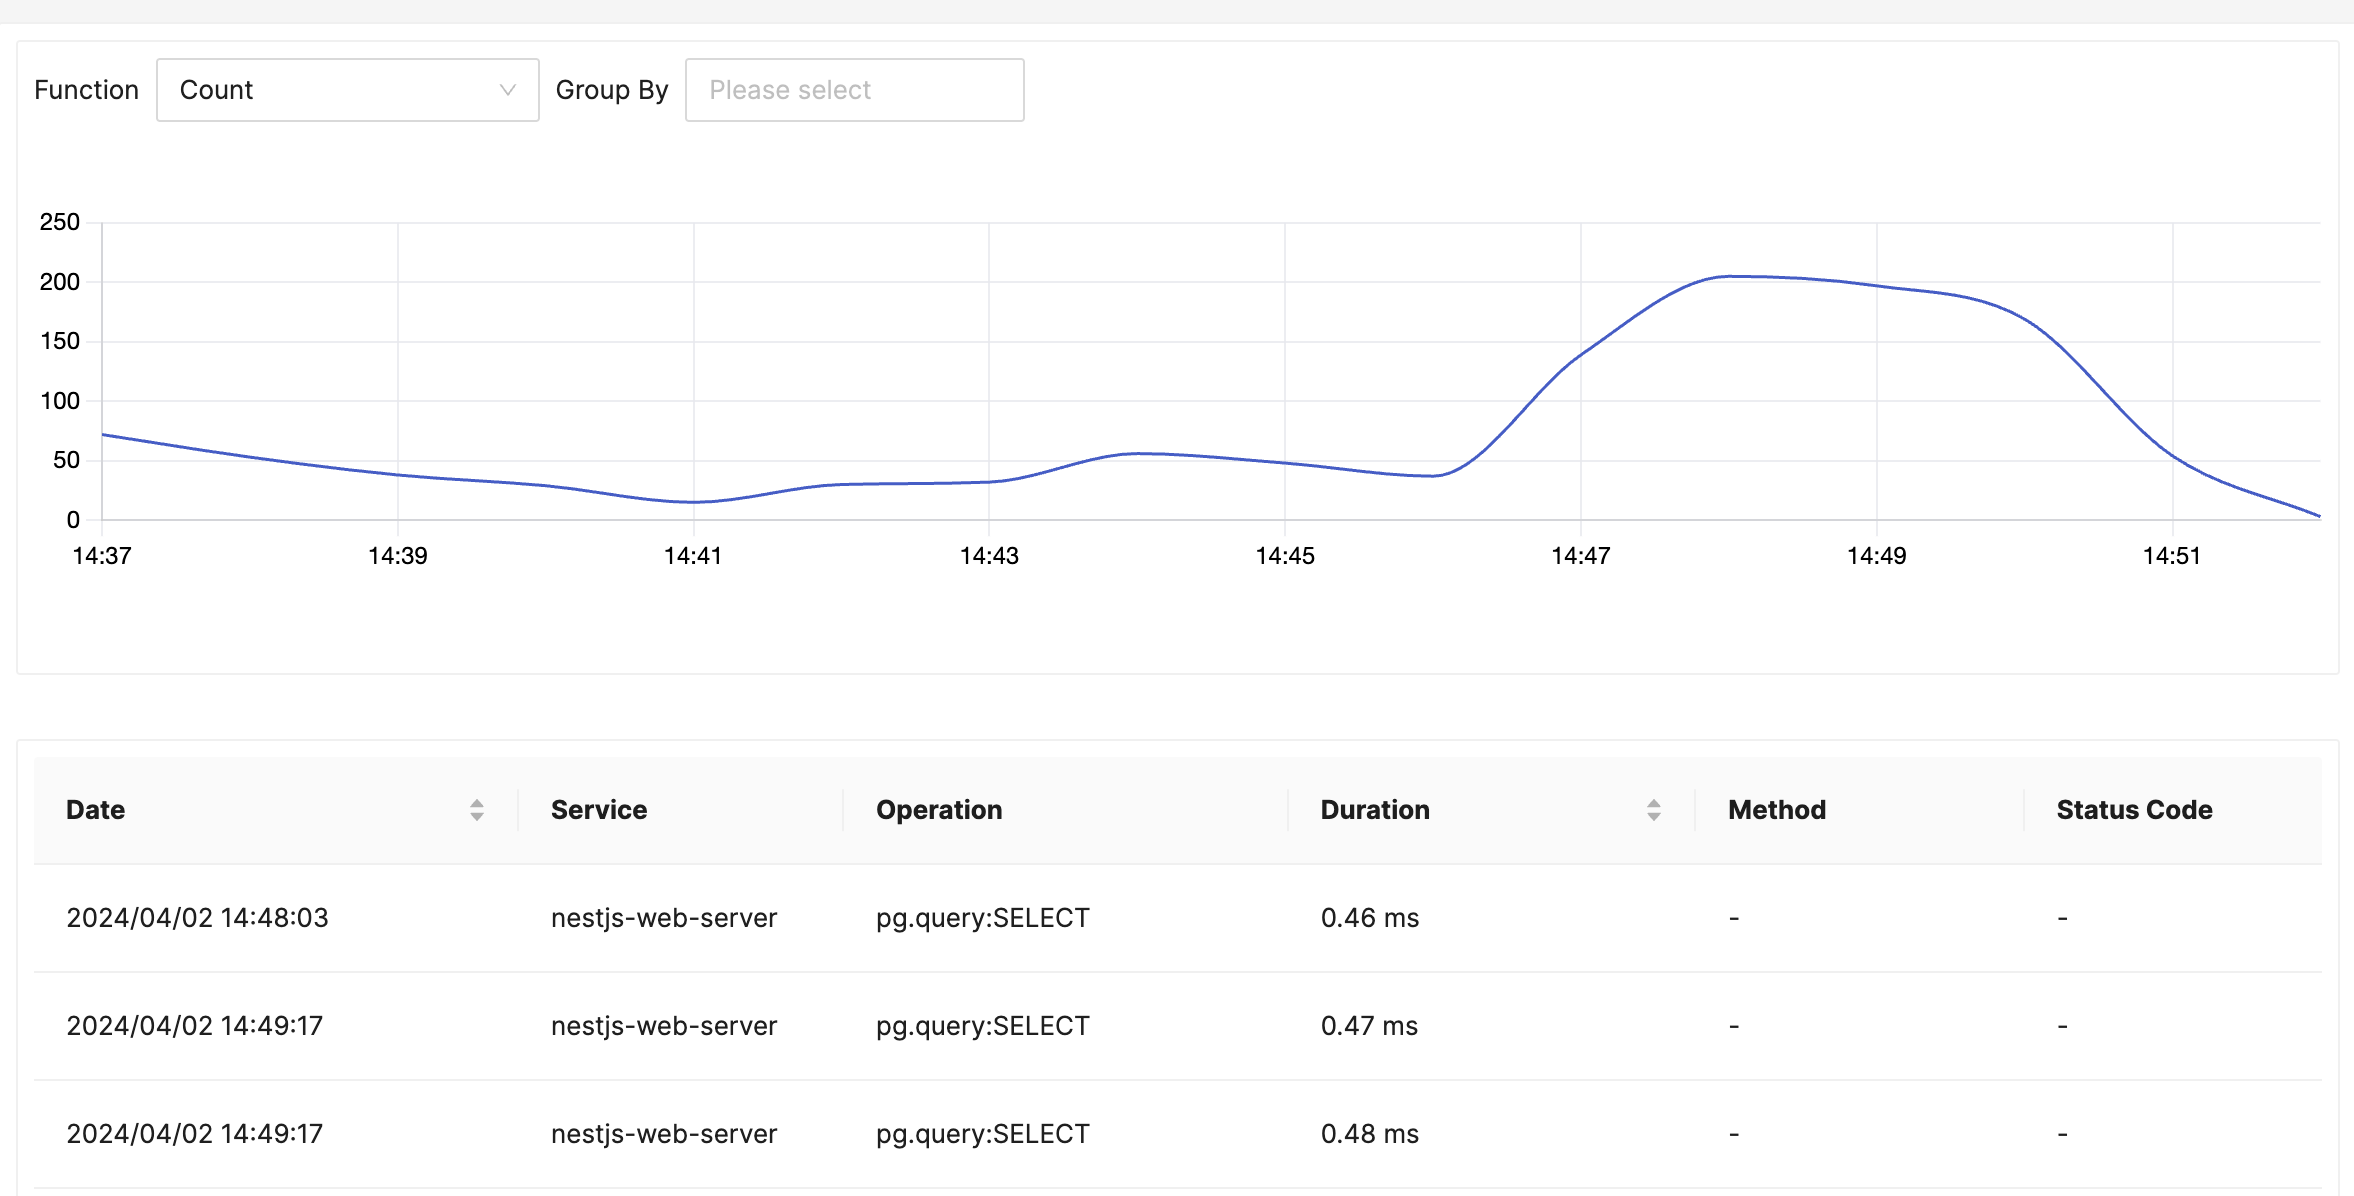
List to All the traces for the selected app, you can filter the traces, check latency, error rate and other metrics
Tech Stack Used
- NodeJS (NestJS - Typescript) as the backend framework
- Bull Queue with Redis as the queue processing solution.
- TypeORM with Postgres for Database
- CI/CD Tool Used: Gitlab CI/CD
- Cloud Infrastructure: AWS with Load Balancers on AWS ECS
- NextJS to serve frontend.
- Signoz Opentelemetry for monitoring.